Electricity
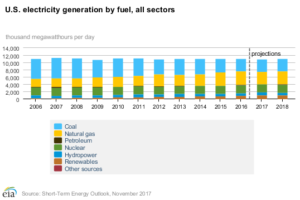
EIA expects the share of U.S. total utility-scale electricity generation from natural gas will fall from an average of 34% in 2016 to about 31% in 2017 as a result of higher natural gas prices and increased generation from renewables and coal. Coal’s forecast generation share rises from 30% last year to 31% in 2017. The projected annual generation shares for natural gas and coal in 2018 are 32% and 31%, respectively. Generation from renewable energy sources other than hydropower grows from 8% in 2016 to a forecast share of about 9% in 2017 and 10% in 2018. Generation from nuclear energy accounts for almost 20% of total generation in each year from 2016 through 2018.
Wind electricity generating capacity at the end of 2016 was 82 gigawatts (GW). EIA expects wind capacity additions in the forecast to bring total wind capacity to 88 GW by the end of 2017 and to 96 GW by the end of 2018.
Total utility-scale solar electricity generating capacity at the end of 2016 was 22 GW. EIA expects solar capacity additions in the forecast will bring total utility-scale solar capacity to 27 GW by the end of 2017 and to 31 GW by the end of 2018.
Watch below table in a Wide Screen mode for a mobile option.
U.S. Electricity Summary |
||||
2015 |
2016 |
2017 |
2018 |
|
Retail Prices |
(cents per kilowatthour) |
|||
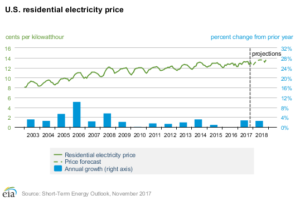
Residential Sector |
12.65 |
12.55 |
12.90 |
13.24 |
Commercial Sector |
10.64 |
10.37 |
10.67 |
11.00 |
Industrial Sector |
6.91 |
6.75 |
6.93 |
7.11 |
Power Generation Fuel Costs |
(dollars per million Btu) |
|||
Coal |
2.23 |
2.11 |
2.13 |
2.20 |
Natural Gas |
3.23 |
2.88 |
3.43 |
3.62 |
Residual Fuel Oil |
10.36 |
8.41 |
10.67 |
10.94 |
Distillate Fuel Oil |
14.47 |
10.86 |
12.73 |
13.22 |
Generation |
(billion kWh per day) |
|||
Coal |
3.705 |
3.388 |
3.376 |
3.432 |
Natural Gas |
3.653 |
3.771 |
3.455 |
3.601 |
Nuclear |
2.184 |
2.200 |
2.184 |
2.185 |
Conventional Hydroelectric |
0.682 |
0.732 |
0.818 |
0.732 |
Renewable (non-hydroelectric) |
0.809 |
0.939 |
1.029 |
1.084 |
Total Generation |
11.172 |
11.145 |
10.977 |
11.164 |
Retail Sales |
(billion kWh per day) |
|||
Residential Sector |
3.85 |
3.85 |
3.76 |
3.88 |
Commercial Sector |
3.73 |
3.71 |
3.71 |
3.71 |
Industrial Sector |
2.70 |
2.56 |
2.61 |
2.65 |
Total Retail Sales |
10.30 |
10.14 |
10.10 |
10.27 |
Primary Assumptions |
(percent change from previous year) |
|||
Real DIsposable Personal Income |
4.2 |
1.4 |
1.4 |
2.3 |
Manufacturing Production Index |
0.2 |
0.2 |
1.5 |
2.0 |
Cooling Degree Days |
14.6 |
4.7 |
-8.1 |
-5.1 |
Heating Degree Days |
-10.2 |
-5.1 |
-1.4 |
10.6 |
Number of Households |
1.0 |
0.5 |
1.0 |
1.2 |