Forecast Highlights
Global liquid fuels
North Sea Brent crude oil spot prices averaged $58 per barrel (b) in October, an increase of $1/b from the average in September. EIA forecasts Brent spot prices to average $53/b in 2017 and $56/b in 2018.
West Texas Intermediate (WTI) crude oil prices are forecast to average almost $5/b lower than Brent prices in 2018. After averaging $2/b lower than Brent prices through the first eight months of 2017, WTI prices averaged $6/b lower than Brent prices in September and October. The spread between Brent and WTI prices is expected to remain at this level through the first quarter of 2018 before narrowing to $4/b during the second half of 2018.
NYMEX contract values for February 2018 delivery that traded during the five-day period ending November 2 suggest that a range of $45/b to $67/b encompasses the market expectation for February WTI prices at the 95% confidence level.
EIA estimates U.S. crude oil production averaged 9.3 million barrels per day (b/d) in October, down 90,000 b/d from the September level. Crude oil production in the Gulf of Mexico averaged 1.4 million b/d in October, which was 260,000 b/d lower than the September level. The lower production reflected the effects of Hurricane Nate. At the time of publication, most oil production platforms in the Gulf of Mexico had returned to operation following the hurricane, and EIA forecasts overall U.S. crude oil production will continue to grow in the coming months. EIA forecasts total U.S. crude oil production to average 9.2 million b/d for all of 2017 and 9.9 million b/d in 2018, which would mark the highest annual average production, surpassing the previous record of 9.6 million b/d set in 1970.
U.S. regular gasoline retail prices averaged $2.51 per gallon (gal) in October, a decrease of 14 cents/gal from the average in September, which was the highest monthly average since July 2015. The September prices reflected the effects of market disruptions following hurricanes Harvey and Irma. EIA forecasts the average U.S. regular gasoline retail price will average $2.47/gal in November and $2.39/gal in December. EIA forecasts that U.S. regular gasoline retail prices will average $2.40/gal in 2017 and $2.45/gal in 2018.
Natural gas
U.S. dry natural gas production is forecast to average 73.4 billion cubic feet per day (Bcf/d) in 2017, a 0.6 Bcf/d increase from the 2016 level. Natural gas production in 2018 is forecast to be 5.5 Bcf/d higher than the 2017 level.
In October, the average Henry Hub natural gas spot price was $2.88 per million British thermal units (MMBtu), down 10 cents/MMBtu from the September level. Expected growth in natural gas exports and domestic natural gas consumption in 2018 contribute to the forecast Henry Hub natural gas spot price rising from an annual average of $3.01/MMBtu in 2017 to $3.10/MMBtu in 2018. NYMEX contract values for February 2018 delivery that traded during the five-day period ending November 2 suggest that a range of $2.08/MMBtu to $4.52/MMBtu encompasses the market expectation for February Henry Hub natural gas prices at the 95% confidence level.
Electricity, coal, renewables, and emissions
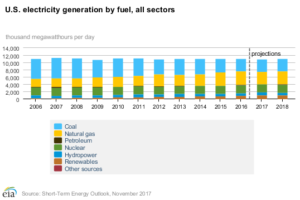
EIA expects the share of U.S. total utility-scale electricity generation from natural gas will fall from an average of 34% in 2016 to about 31% in 2017 as a result of higher natural gas prices and increased generation from renewables and coal. Coal’s forecast generation share rises from 30% last year to 31% in 2017. The projected annual generation shares for natural gas and coal in 2018 are 32% and 31%, respectively. Generation from renewable energy sources other than hydropower grows from 8% in 2016 to a forecast share of about 9% in 2017 and 10% in 2018. Generation from nuclear energy accounts for almost 20% of total generation in each year from 2016 through 2018.
Coal production for the first 10 months of 2017 is estimated to have been 656 million short tons (MMst), 59 MMst (10%) higher than production for the same period in 2016. Annual production is expected to be about 790 MMst in both 2017 and 2018.
Wind electricity generating capacity at the end of 2016 was 82 gigawatts (GW). EIA expects wind capacity additions in the forecast to bring total wind capacity to 88 GW by the end of 2017 and to 96 GW by the end of 2018.
Total utility-scale solar electricity generating capacity at the end of 2016 was 22 GW. EIA expects solar capacity additions in the forecast will bring total utility-scale solar capacity to 27 GW by the end of 2017 and to 31 GW by the end of 2018.
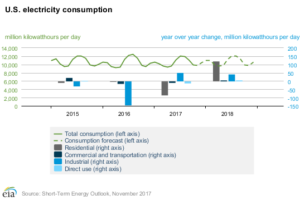
After declining by 1.6% in 2016, energy-related carbon dioxide (CO2) emissions are projected to decrease by 0.8% in 2017 and then to increase by 2.1% in 2018. Energy-related CO2 emissions are sensitive to changes in weather, economic growth, and energy prices.
Watch below table in a Wide Screen mode for a mobile option.
Price Summary
|
|
|
2015
|
2016
|
2017
|
2018
|
a West Texas Intermediate.

 b Average regular pump price.

 c On-highway retail.

 d U.S. Residential average.
|
WTI Crude Oila

 (dollars per barrel)
|
48.67
|
43.33
|
49.70
|
51.04
|
Brent Crude Oil

 (dollars per barrel)
|
52.32
|
43.74
|
53.01
|
55.61
|
Gasolineb

 (dollars per gallon)
|
2.43
|
2.15
|
2.40
|
2.45
|
Dieselc

 (dollars per gallon)
|
2.71
|
2.31
|
2.65
|
2.83
|
Heating Oild

 (dollars per gallon)
|
2.65
|
2.10
|
2.51
|
2.71
|
Natural Gasd

 (dollars per thousand cubic feet)
|
10.36
|
10.04
|
11.07
|
10.92
|
Electricityd

 (cents per kilowatthour)
|
12.65
|
12.55
|
12.90
|
13.24
|