Plug loads are an important contributor to a building’s peak air-conditioning load and energy consumption. Plug loads over time have evolved to become a larger percentage of a building’s overall heat gain. Two factors are responsible for this increased significance. First, over time, computer use has continued to increase resulting in a much larger number of personal computers in use in buildings. Second, advances in building techniques have improved envelopes and reduced that portion of the load/energy use.
As building envelope and system technology have improved, computer technology has advanced. Lower energy notebook computer and LCD monitor use are more widespread while at the same time, computing power, peripherals use, and enhanced or multiple monitors use have increased.
The industry is moving toward a much greater focus on low energy and even net zero energy buildings. Part of this industry movement results in a need to design based on the lowest possible plug load assumptions. Every project or application is different, and engineers are often asked to apply their judgment for plug load assumptions without the benefit of all the needed or available information. This article is intended to provide data and recommendations that will allow engineers to make these important decisions on just how low they can go in terms of plug load assumptions for a specific project or application.
Historical Perspective
Computer use in buildings started to become prevalent and began to be a consideration in building air-conditioning loads in the 1980s. At that time, loads were generally calculated based on the nameplate data on the computers and other electronic equipment. In the late 1980s, computer use began to become more widespread. In this era, the authors observed that it was not uncommon for air-conditioning systems to be sized for plug loads of 3 to 5 W/[ft.sup.2] (32 to 54 W/[m.sup.2]).
A 1991 ASHRAE Journal article (1) reported on research done in Finland where the actual load from computers and other equipment was measured and compared to nameplate data. This relatively modest effort revealed that the measured load of this equipment was typically only 20% to 30% of the nameplate data. This revelation provided the first hard evidence of this issue and changed the way that plug loads were considered in load and energy calculations.
Next, Wilkins and McGaffin in 1994 (2) reported measurements in five U.S. General Services Administration (GSA) office buildings in the Washington, D.C. area. Their work included informal measurement of a large sample of individual equipment items, as well as measurements at panels that served computer equipment within a given area of the building. The results provided further verification of the nameplate discrepancy of individual equipment, provided measured data for the determination of the load factor of an area and, for the first time, allowed the load diversity factor to be derived based on measured data.
ASHRAE followed up this informal research with the execution of two research projects: RP-822 (1996), “Test Method for Measuring the Heat Gain and Radiant/Convective Split from Equipment in Buildings” and RP-1055 (1999), “Measurement of Heat Gain and Radiant/Convective Split from Equipment in Buildings.” (3,4) The experimental results corroborated the earlier findings but did so in a more formal and traceable manner. All of this work led to a widely referenced ASHRAE Journal article in 2000. (5) This data was incorporated into the ASHRAE Handbook–Fundamentals starting in 1997 and then significantly expanded in the 2001 edition.
Current ASHRAE Handbook Data
Data presented in the 2009 ASHRAE Handbook–Fundamentals, Chapter 18, Nonresidential Cooling and Heating Load Calculations, relative to office equipment loads (or plug loads) is based largely on the research and publications cited previously. Data is presented in a number of formats and breakdowns but can be best summarized by considering Table 11 in Chapter 18, which states that a “medium density” office building will have a plug load of 1 W/[ft.sup.2] (10.8 W/[m.sup.2]). It is believed that this value of 1 W/[ft.sup.2] (10.8 W/[m.sup.2]) has been widely used in the industry since the mid 1990s. The authors believe this value is, and always has been, somewhat conservative when used in office environments. However, its use has proven to provide an appropriate balance to cover potential future loads while not introducing significant over-design in building systems.
Trends to Date
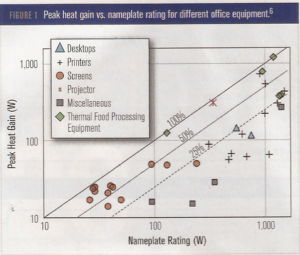
This approach and recommended load factor have remained roughly the same since the mid-1990s. Computer technology has certainly changed since that time but until recently, there was no need to change the use of 1 W/[ft.sup.2]. In fact, a comprehensive study was conducted by Koomey, et al, (6) and reported in December 1995 where it was predicted that plug loads in office buildings would decrease modestly through at least 2010 (Figure 1).
This decrease was expected to be due to technical advances that would result from ENERGY STAR and other related programs. Their predictions were based on energy use, not peak load values, but it is believed that these trends would be similar and, in fact, history has proven this to be the case. Office equipment has become more efficient, and overall plug load intensity has decreased.
Current State of Plug Loads
Predicting the future of the information technology (IT) world is not attempted here, but recent studies, as described later, have provided new data that gives a clearer picture of the current state of plug loads. It is important to understand the current state of the equipment that contributes to plug loads and how this equipment now in use differs from equipment in use at the time 1 W/[ft.sup.2] (10.8 W/[m.sup.2]) was found to be an appropriate load factor. Hosni and Beck have recently completed the latest ASHRAE-sponsored research project RP-1482, “Update to Measurements of Office Equipment Heat Gain Data,” (7) where measurements were obtained from an up-to-date sample of office equipment including notebook computers (laptops) and flat screen (LCD) monitors.
Table 1 shows how this most recent data compare to previously referenced work, as well as some other data from Kawamoto (8) and Moorefield (9) for some of the most common office equipment. Desktop computers show a trend toward increasing peak energy but the sleep mode has become much more effective over time. This increase in the desktop computer peak wattage has been offset by the lower power consumption of LCD monitors. Using a notebook computer, instead of a desktop computer and an LCD monitor, results in a fairly significant reduction in peak wattage. It is clear that notebook computer’s popularity, flexibility, cost, and computational power have expanded their use and is expected to result in a meaningful reduction in plug load power levels.
In the work by Moorefield, four modes of operation for computers and monitors were considered that included active, idle, sleep, and standby. These categories were determined by statistical grouping of the measured data and not based on internal operation of the equipment. Power consumption during what was referred to as sleep and standby was generally low and corresponded to the findings for what was called either idle or sleep mode by Hosni in RP-1482.
For the purposes of load calculation discussions, it seems that consideration of only two modes, active and sleep is appropriate. Moorefield also reported periods of notebook computer operation with power levels as high as 75 W, but no explanation for what contributed to this was provided.
Notebook computers may introduce a secondary peak condition that could occur when the internal battery is charging while at the same time the notebook is in full use. This condition may increase the power consumption by as much as 10 W during the charging period according to informal measurements by Hosni. The data shown in Table 1 represent the peak for fully charged battery condition.
Recognizing that computers and monitors represent the largest share of the plug loads in most conventional office buildings, the power reduction during idle operation will certainly have a significant impact on energy consumption and may be having an impact on the peak cooling load as well. The question to be answered in terms of peak air-conditioning load is how much of the equipment is in sleep mode at the time of peak air-conditioning load. To answer this, diversity factor must be considered.
Diversity Factors
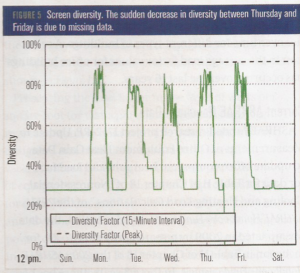
Diversity factors were not presented in the work by Moorefield, but the data that were collected did allow for an approximation of diversity factor to be calculated. Energy use data were collected from groups of individual items of equipment and then these groups of data were averaged. Diversity is then the average measured energy divided by the peak measured energy. In this case, the peak measured represents the average of the peaks for all equipment of the given type that was in the study.
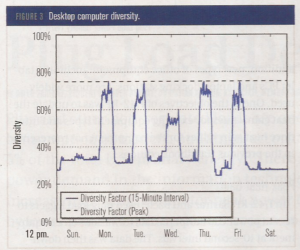
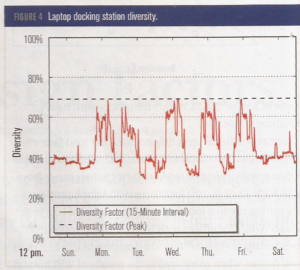
Figures 3 and 4 represent detailed curves for desktop computers diversity and Laptop docking station diversity. A single week of data was chosen and presented that represents the higher end of usage.. For the purposes of the table and the development of load factors discussed later, the diversity factor for Laptop docking station was assumed to be the same as for desktop computers.
Impact on Load Factors
The most useful form of this data for use by engineers performing load calculations is when it is presented as a load factor such as watts per square foot (W/ [ft.sup.2]). This new equipment and diversity factor data were coupled with some general assumptions and used to generate the updated load factor data presented in Table 3. It can be seen that if 100% notebook use is assumed and typical diversity factors are applied, plug loads could realistically be as low as 0.25 W/[ft.sup.2] (2.7 W/[m.sup.2]). Even light and medium use of desktop computers results in plug loads below the traditional 1 W/[ft.sup.2] (10.8 W/ [m.sup.2]). More extreme scenarios can be considered such as the case where all workstations use two full-sized monitors that can result in plug load of 1 W/[ft.sup.2] or more. The most extreme scenario considered assumes very dense equipment use with no diversity at all and results in a plug load factor of 2 W/[ft.sup.2] (21.5 W/[m.sup.2]).
The load factors presented are based on hypothetical conditions with the best available data applied to them. Each of these includes a factor to account for some level of peripheral equipment such as speakers. This analysis suggests that there will be many cases where the design plug load can be assumed to be below the traditional value of1 W/[ft.sup.2] (10.8 W/[m.sup.2]) without risk of under-designing the system. There are many factors that could impact the actual plug load for a specific space or building and careful consideration must be given to the assumptions used for any given condition.
Conclusions
Nearly all building projects today have a goal of using the minimum energy possible and having a small overall carbon footprint. Computer equipment used in offices has been a part of the overall trend toward energy use reduction. It is now possible to realistically conceive of an office space that could have a peak plug load as low as 0.25 W/[ft.sup.2] (2.7 W/[m.sup.2]). When this lower plug load level is coupled with the lower lighting power density targets, the result is the building internal loads are being reduced to very low levels.
Using a very low plug load assumption in an attempt to design ultra-low energy buildings comes with some risk. The occupant at the time of design may have fully embraced a low-energy office mentality, but in the future, there may be new occupants with less dedication or equipment with different energy consumption. However, the new data suggests that the time has come to reexamine the use of 1 W/[ft.sup.2] (10.8 W/[m.sup.2]) as the default industry norm.